
Correcting LLM Equity Valuation: why we withdrew our Grüns figures and what replaces them
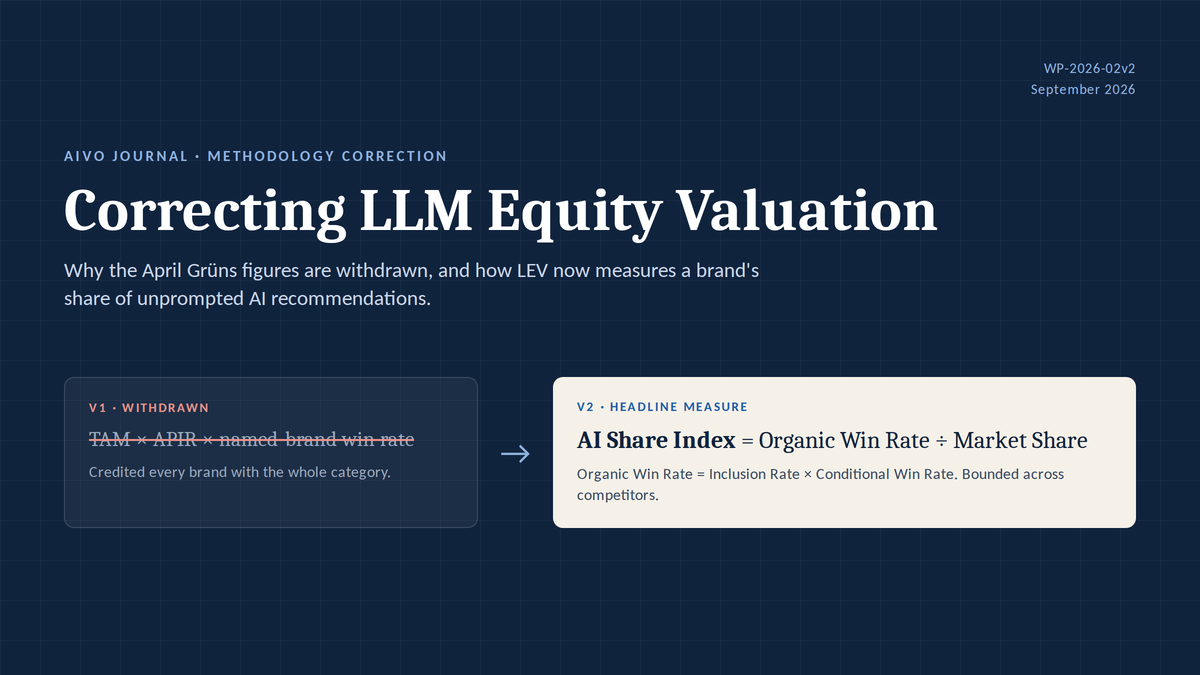
AIVO has revised LEV, its framework for valuing a brand's standing in AI purchase recommendations during acquisitions. The original formula overstated the revenue a brand could reach through AI, so we have withdrawn the figures we published for Grüns in April. The revised framework compares a brand's share of unprompted AI recommendations with its share of the market.
In April we published LLM Equity Valuation (WP-2026-02), a framework for pricing what a brand is worth inside AI purchase recommendations. We used it to report that Grüns, whose acquisition by Unilever was widely reported at $1.2 billion, had an LLM equity of about $186 million. A review of the method found that this figure was wrong, and the error was in the formula itself. The revised paper, WP-2026-02v2, corrects the formula, withdraws the Grüns numbers and sets out how the framework should be tested before anyone relies on it for pricing.
What went wrong
The original formula multiplied category market size by the share of purchases AI influences and by the brand's win rate in our four-turn buying probe. That probe names the brand from the first turn and tests whether it survives to the final recommendation. So it measures how often a brand wins once a buyer is already asking about it. It does not measure how often a brand wins an ordinary conversation in which the buyer asks an assistant for help choosing and names no brand at all.
Using the first number in place of the second credits every brand with the whole category. Apply the original formula to every competitor in a category and the totals can exceed the category's entire AI-influenced revenue several times over.
A second error compounded the first. We compared LEV, an annual revenue figure, with the acquisition price, which is a capitalised multiple of earnings. The resulting coverage ratio of 15.5% and the $1.014 billion "AI channel gap" divided and subtracted numbers measured in different units. Under that comparison, even a brand that dominated its category's AI recommendations would have appeared to carry a large liability.
The $186 million figure, the 15.5% ratio and the $1.014 billion gap are withdrawn. We will not publish a replacement until Grüns has been measured under the corrected method.
What replaces it
The revised framework adds an organic probe. It runs buying conversations built from unbranded prompts across the major assistants and logs every brand the model surfaces and the one it finally recommends. A single probe measures every brand in the category at once.
The central measure is the Organic Win Rate: the share of unprompted category conversations in which the assistant makes the brand its final recommendation. Each conversation awards at most one recommendation, so the rates for all brands in a category cannot add up to more than the whole. The Organic Win Rate also splits cleanly into two parts. Inclusion Rate is how often the brand is mentioned at all. The conditional win rate is how often it is chosen once mentioned. That split tells an acquirer whether a weak result is a visibility problem, a conversion problem or both, and the fix differs in each case.
The named-brand probe stays as a diagnostic. We now call its output the Defended Win Rate, meaning how well a brand holds up when a buyer asks about it directly. A brand that defends well but is rarely volunteered by the assistant has a different problem from one that is surfaced often and then loses.
The headline measure
The revised paper leads with the AI Share Index: the brand's Organic Win Rate divided by its market share. A score of 1.0 means the brand wins AI recommendations in line with its position in the market. A score of 0.4 means it wins less than half the AI recommendations its market position would predict. Because the index compares two shares, it does not depend on estimates of market size or AI adoption, which are the least certain inputs in any calculation of this kind. That makes it comparable across categories and across transactions.
Where a dollar figure is needed, the framework calculates an annual AI Revenue Gap relative to parity with market share. That gap can then be capitalised at the transaction multiple, so it is finally expressed in the same units as the price being paid.
What we know about Grüns
On the day the deal was announced, we ran ten named-brand buying sequences on two platforms. Grüns performed poorly and recorded an aggregate score of 8 out of 100. The run-by-run outcomes were not retained, and ten sequences carry a wide margin of error, so we treat this as a qualitative signal. It shows that a brand bought for a reported $1.2 billion struggled to hold its position when buyers asked AI assistants about it by name, and that standard diligence would not have picked this up.
It does not tell us whether Grüns was rarely mentioned in unprompted conversations, or how its share of AI recommendations compared with its share of the greens supplement market. Only the organic probe can answer those questions, and a re-probe is specified in the revised paper.
Why existing valuation frameworks miss this
Interbrand, Kantar BrandZ and Brand Finance each combine financial analysis with measures of how people perceive a brand: its role in choice, consumers' predisposition towards it, and the pricing power it commands. All three measure a brand's hold on people. None observes the behaviour of an AI intermediary that increasingly stands between the consumer and the decision. A brand can score well on consumer predisposition and still rarely be volunteered by an assistant, and that shortfall shows up in earnings only later. We see the AI Share Index as a complement to these frameworks, including as a possible input to brand strength assessments.
What still has to be proven
LEV assumes that AI-influenced purchases are shared among brands in proportion to their share of final AI recommendations. That assumption is reasonable, but it has not been tested. Until it is, LEV is a coherent positional measure and not a validated revenue estimate. The revised paper sets out three tests:
- a comparison of Organic Win Rate with AI-referred revenue across a panel of brands, using the AI Traffic Attribution Convention to classify that traffic consistently;
- a longitudinal study of whether changes in recommendation share come before changes in AI-referred revenue;
- a survey of how often AI-assisted buyers purchase the brand the assistant finally recommended.
Frameworks used to value brands should be held to the same scrutiny as the brands they assess. That applies to ours. The revised working paper is DOI-anchored on Zenodo, and we welcome challenge to the method.
 de Rosen, Tim
Comments ()