When “4.3M Prompts” Isn’t 4.3M Prompts

A forensic look at modeled prompt volumes and governance risk
Executive Summary
Dashboards claiming to show “millions of AI prompts” are proliferating. The pitch is simple: type in a term and you get back a precise number of times users asked it in ChatGPT, Gemini, or Claude. These numbers are being positioned as if they are observed counts, akin to search volumes in Google Keyword Planner.
The reality is less robust. None of the major LLM vendors provide raw usage logs. What is presented as factual is, in fact, modeled: panel data scaled to population estimates. When these projections are stripped of error margins and displayed as integers, they mislead.
For boards and executives, the danger is not academic. Treating modeled volumes as truth introduces measurable financial, strategic, reputational, operational, and governance risks. This article dissects how those numbers are produced, why they fail governance tests, and what boards should demand instead.
1. How the Numbers Are Made
The methodological chain has three links:
- Source: Vendors gather data from panels of opt-in users. These panels typically rely on browser extensions, partner apps, or voluntary prompt shares. Panels are directionally useful, but inevitably biased: skewed toward early adopters, tech-heavy industries, and self-selecting demographics.
- Projection: Panel samples are then weighted and extrapolated. Demographic and geographic weights are applied to produce “population-level” estimates. This is standard in audience measurement — Nielsen has long done the same for TV audiences — but the difference lies in disclosure.
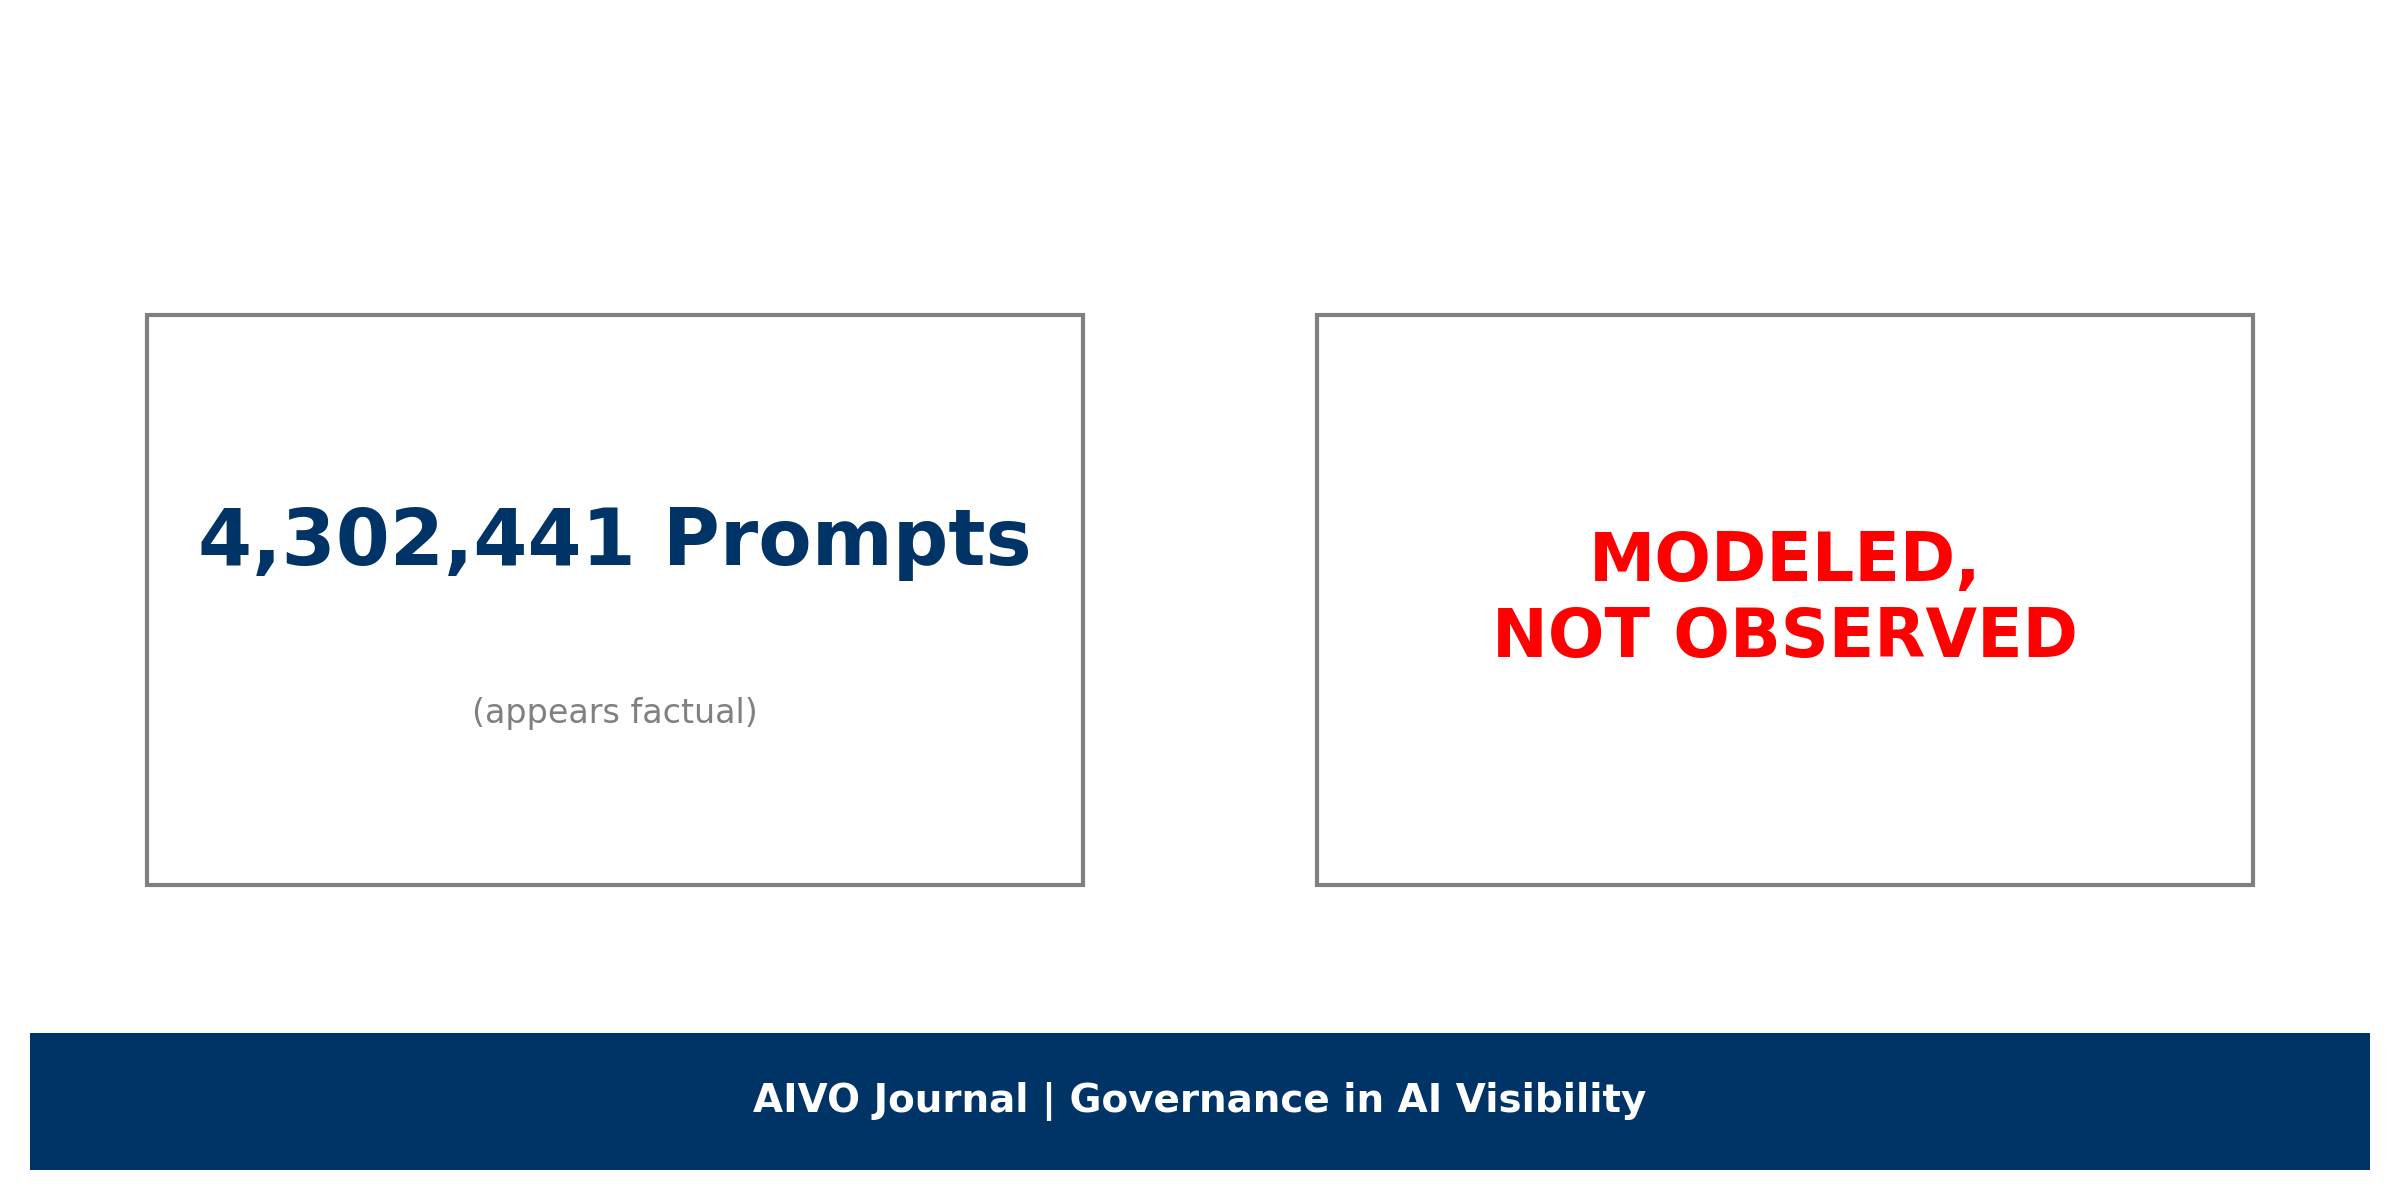
- Presentation: The modeled totals are surfaced in dashboards as precise integers — “4,302,441 prompts this week.” Error margins and probabilistic language are pushed to footnotes or omitted entirely. To the executive user, the number appears factual, not modeled.
This chain is not fraudulent. Panels and projections are legitimate research methods. But when presented without uncertainty, they create a false sense of precision.
2. Evidence from Vendor Claims
Examining vendor marketing language shows a gap between headline claims and methodological footnotes:
- Headlines: “Real user prompts,” “Observed AI search demand,” “Millions of prompts per month.”
- Methodology notes (small print): “Panel-based,” “probabilistic projection,” “weighted estimates,” “demographic balancing.”
UI screenshots show the key problem: dashboards emphasize precise totals with no visible error bars. Disclosure is technically present, but practically invisible.
The mismatch matters because executives and boards rarely read methodology appendices. They act on the number presented. If the number looks like an observed fact, it will be treated as such.
3. Why Weighting Doesn’t Remove Bias
Vendors argue that demographic weighting eliminates panel bias. Statistically, this is impossible. Weighting corrects some skews (age, gender, geography) but cannot fully adjust for behavioral differences.
For example: if early adopters in finance use ChatGPT for research ten times more often than the weighted average predicts, the extrapolated volume will overstate true population demand. Without independent benchmarks, error margins cannot be validated.
The issue is not that panels are wrong — it is that their uncertainty is unknown and undisclosed. Presenting modeled totals without error bands is therefore misleading.
4. Governance Risks
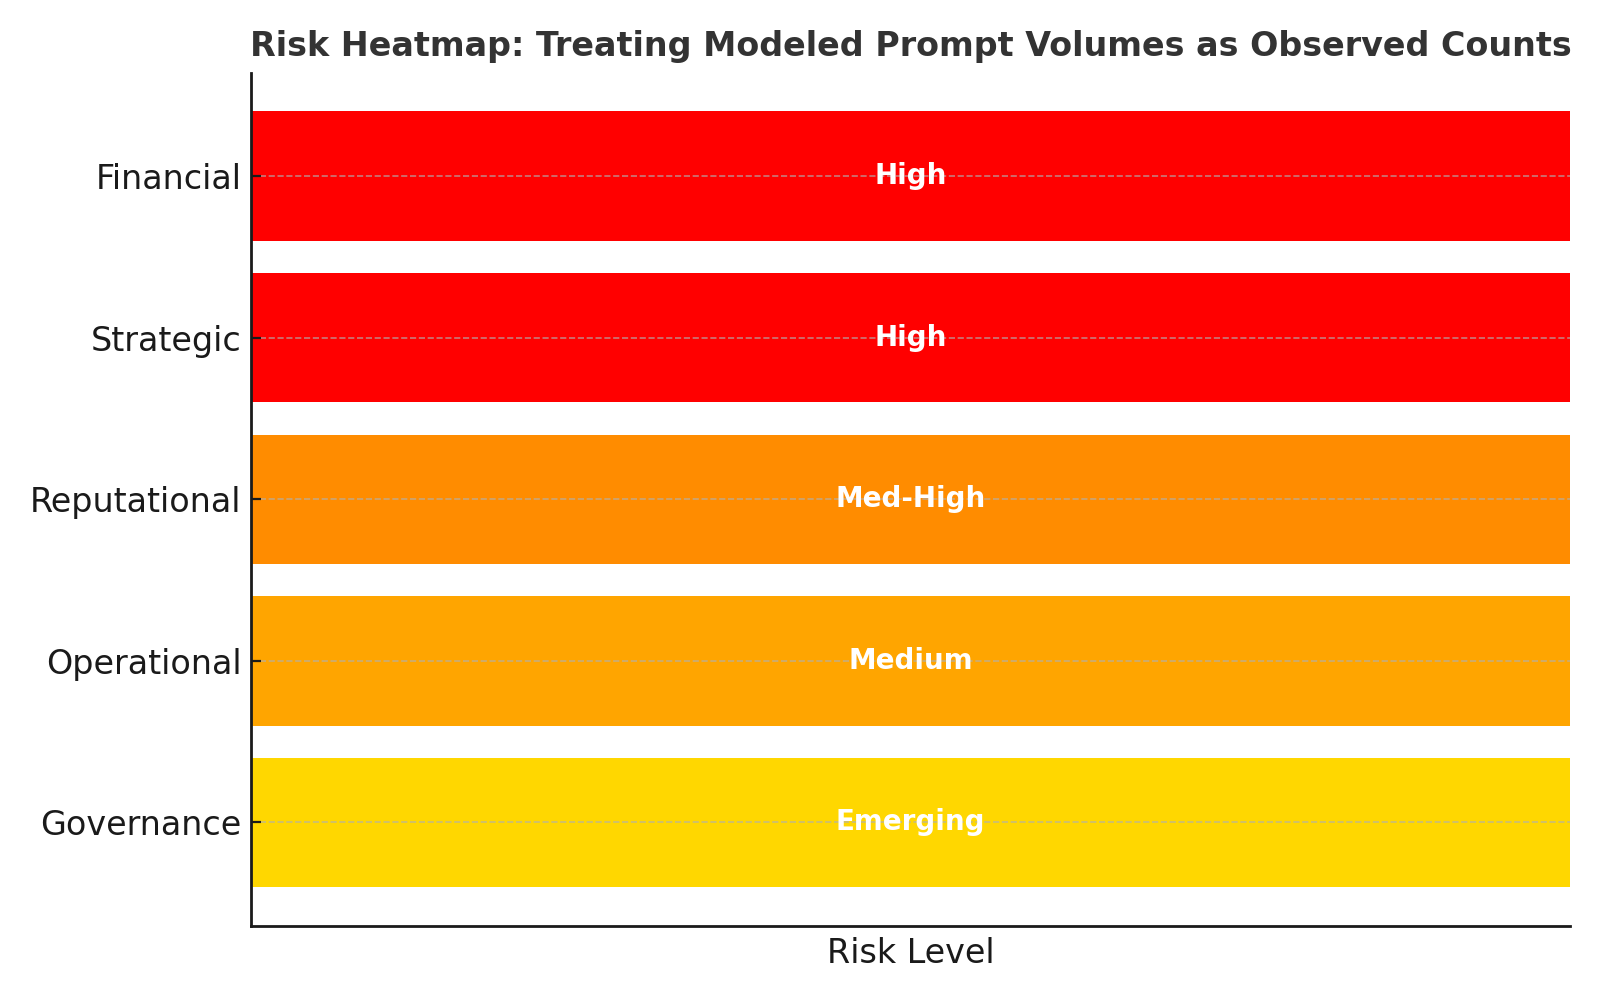
Boards that treat modeled prompt volumes as factual expose themselves to five classes of risk.
| Risk | Mechanism | Estimated Exposure |
|---|---|---|
| Financial (High) | Budgets flow to “high-volume” prompts that are artifacts. Agencies upsell against inflated counts. | 20–40% wasted spend in early adoption. |
| Strategic (High) | False prioritization of prompts. Real early-mover signals ignored because they appear “too small.” | High probability of missed opportunities. |
| Reputational(Med-High) | Forecasts built on inflated numbers collapse. Boards and investors lose trust in CMO reporting. | Medium-term erosion of credibility. |
| Operational(Medium) | Sales and marketing teams misalign around “fake precision.” Over-reliance on one vendor creates fragility. | Medium, compounding over time. |
| Governance(Emerging) | Non-auditable data enters board packs and ESG reporting. Regulators may flag reliance on unverified sources. | Low today, but rising quickly. |
The risk is not in using panels. It is in mistaking modeled estimates for observed truth.
| Risk Type | Level | Notes |
|---|---|---|
| Financial | 🔴 High | 20–40% wasted spend |
| Strategic | 🔴 High | Missed early signals |
| Reputational | 🟠 Med-High | Forecast credibility erosion |
| Operational | 🟠 Medium | Internal miscoordination |
| Governance | 🟡 Emerging | Non-auditable data risk |
5. Anticipating Counterclaims
To withstand scrutiny, we must acknowledge what vendors will argue:
- “We only sell trends.” If so, the UI should show indexed values with error bands, not integers that look like observed counts.
- “Bias is corrected with weighting.” Weighting reduces bias, but cannot erase it. Vendors offer no independent benchmarks for validation.
- “Enterprise users are included.” Even if some are, most enterprise prompts sit behind SSO and NDAs. Panels and extensions rarely reach these.
Without explicit disclosure, these counterclaims collapse under governance audit.
6. Modeled Volumes vs PSOS: A Redline
Boards need to distinguish between modeled estimates of user demand and observed measures of brand visibility. The two are not equivalent.
| Modeled Prompt Volumes | Prompt-Space Occupancy Score (PSOS™) |
|---|---|
| Panel samples, projected to population | Observed brand presence/absence in AI assistants |
| Useful for trend detection | Essential for revenue protection |
| Probabilistic, non-reproducible | Timestamped, reproducible, auditable |
| Error margins undisclosed | Decay and substitution tracked explicitly |
| Not governance-grade | Governance KPI suitable for ExCo/board reporting |
7. Safe Board Positioning
Boards should adopt four simple principles:
- Transparency: Demand disclosure of panel sources, sizes, and weighting methods. Require holdout validation error where available.
- Uncertainty: Require vendors to present confidence intervals in the same viewport as totals. If they cannot, treat the data as indicative only.
- Guardrails: Prohibit modeled totals from appearing in financial reports or board packs without caveats.
- Adopt PSOS: Anchor AI visibility governance in PSOS — the only audit-grade KPI that measures whether a brand actually surfaces in AI assistants.
8. The Role of Trend Signals
This is not a call to discard panel data. Panels can be useful for spotting early topic clusters or directional shifts. Treat them as hypothesis generators.
The failure is in treating them as truth. The moment a modeled number is allowed into board-level KPI reporting, governance breaks down.
Conclusion
Dashboards showing “millions of AI prompts” are not fraudulent, but they are not observed truth. They are modeled estimates, presented with a false veneer of precision.
Boards should recognize their limited value: useful for directional sense-making, dangerous if treated as fact.
The governance redline is simple: volumes are noise; visibility is signal. What matters is whether your brand surfaces when it counts. That is what Prompt-Space Occupancy Score (PSOS™) measures.
FAQ
Q: Are these numbers fake?
A: No. They are modeled estimates from panels. The problem is the way they are presented — as if they were observed counts.
Q: Should we ignore them?
A: No. Use them for trend detection. But do not base KPIs, budgets, or forecasts on them.
Q: Why PSOS?
A: PSOS measures actual brand presence in AI assistants, with timestamped reproducible logs. It is auditable, unlike panel projections.